

In the October 2026 Visa Bulletin, the dates at which China-born EB-2 and EB-3 applicants can file their green card application jumped a long way. People in the group chats are saying it looks like October 2020. This article puts the two side by side, using only our own bulletin database and official pages: how far it jumped then, and what happened over the next year.
The short answer: similar, with one big difference. This time the jump is on the chart that says when you can file (Chart B). The chart that says when a green card can be approved (Chart A) has barely moved. In October 2020 Chart B jumped too, but Chart A then moved forward a lot over the following year, and EB-1 became fully current within six months. We don't predict whether this time will be the same. We show the path back then, and what happened 6 and 12 months after every past big jump.
Two terms first:
- Chart A and Chart B. Each monthly bulletin has two charts. Chart A (Final Action Dates): green cards can be approved once your date is earlier than this date. Chart B (Dates for Filing): you can submit your I-485 once your date is earlier than this date. USCIS announces which chart applies each month. Filing is not approval.
- Priority date. Your place in the line: the day you got in line.
01 October 2020 and October 2026: how far each chart moved

China mainland, September to October, in months:
| Category and chart | Sep → Oct 2020 | Moved | Sep → Oct 2026 | Moved |
|---|---|---|---|---|
| EB-1 Chart A | 2018-03-01 → 2018-06-01 | 3 months | 2023-07-01 → 2023-07-01 | none |
| EB-1 Chart B | 2018-07-01 → 2020-09-01 | 26 months | 2023-12-01 → 2024-07-01 | 7 months |
| EB-2 Chart A | 2016-01-15 → 2016-03-01 | about 1.5 months | 2021-09-01 → 2021-10-01 | 1 month |
| EB-2 Chart B | 2016-08-01 → 2016-10-01 | 2 months | 2022-01-01 → 2023-01-01 | 12 months |
| EB-3 Chart A | 2017-02-15 → 2017-07-01 | about 4.5 months | 2022-01-08 → 2022-01-08 | none |
| EB-3 Chart B | 2017-05-01 → 2018-06-01 | 13 months | 2022-01-08 → 2024-04-01 | about 27 months |
Two things to notice:
- In 2020 the biggest jump was EB-1 Chart B (26 months), with EB-3 Chart B at 13. This time the biggest is EB-3 Chart B (about 27 months), with EB-2 Chart B at 12. This year's EB-3 jump is about twice the 2020 EB-3 jump.
- Chart A hardly moved this time: EB-1 and EB-3 did not move, EB-2 moved 1 month. So more people can file, not more people can be approved.
Which chart did USCIS tell people to use? For October 2026, USCIS says to use Dates for Filing (Chart B) for all employment-based categories. In October, November and December 2020 it was also Chart B, and in January 2021 it went back to Chart A.
02 The year after October 2020: where Chart A went
After October 2020, Chart A did not move all at once. It moved month by month (China mainland, Chart A):
| Bulletin month | EB-1 | EB-2 | EB-3 |
|---|---|---|---|
| Sep 2020 | 2018-03-01 | 2016-01-15 | 2017-02-15 |
| Oct 2020 | 2018-06-01 | 2016-03-01 | 2017-07-01 |
| Jan 2021 | 2019-09-01 | 2016-06-01 | 2017-12-15 |
| Apr 2021 | current | 2016-09-01 | 2018-03-15 |
| Jul 2021 | current | 2017-12-01 | 2019-01-01 |
| Sep 2021 | current | 2018-07-01 | 2019-01-08 |
| Nov 2021 | current | 2018-11-15 | 2018-03-22 |
Over that year EB-1 went from 2018-03-01 to current, EB-2 from 2016-01-15 to 2018-07-01 (about 30 months), and EB-3 from 2017-02-15 to 2019-01-08 (about 23 months). In November 2021 EB-3 moved back to 2018-03-22 and EB-2 moved ahead of it. We cover that stretch in more detail in the downgrade article.
03 Why it could move: about twice the usual number of visas

The official numbers we could find:
- The State Department's September 2021 bulletin says the fiscal year 2021 limit (October 2020 to September 2021) for employment-based preference immigrants is 262,288.
- USCIS's FAQ page says this was "nearly double the typical annual total". The two agencies combined used 195,507 employment-based visas in FY 2021 (DOS issued 19,779; USCIS used 175,728 through adjustment of status, more than 52% above the pre-pandemic average), and 66,781 went unused.
- The FY 2022 limit was 281,507, again slightly more than double the typical total.
So Chart A could keep moving in 2020 and 2021 because that year had unusually many visa numbers. "More visa numbers" is the official figure. "That is why the dates moved" is our reading, not an official statement.
We have not found an official number for fiscal year 2027, which starts this month, so we can't say whether this year has more or fewer numbers than 2021. That is the most important thing to keep apart from 2020: back then there was a specific reason, and this year we don't yet know whether there is one.
04 After past Chart B jumps: 6 and 12 months later
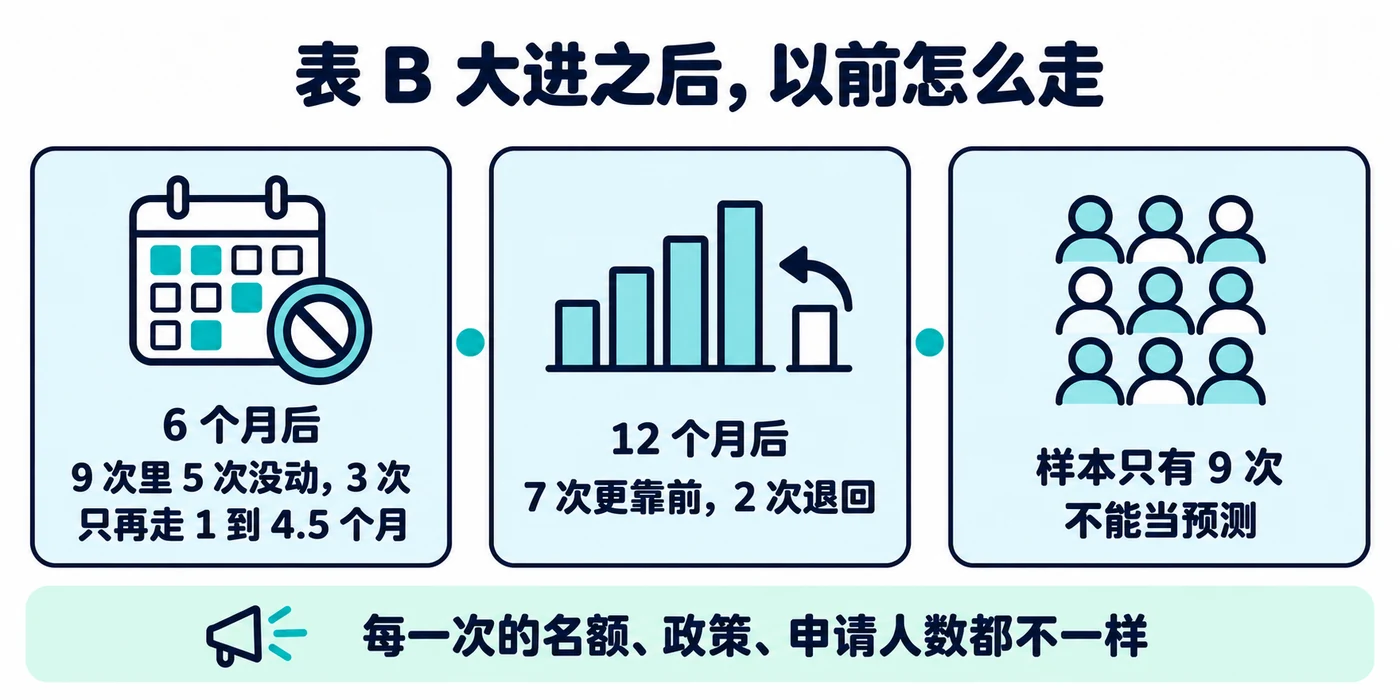
We found every time since February 2016 when China EB-2 or EB-3 Chart B moved forward 9 months or more in a single month (the two charts exist from October 2015; we start in February 2016 to skip the first months of the new format), and looked at what came next:
| Month of the jump | Category | Moved that month | Jumped to | After 6 months | After 12 months |
|---|---|---|---|---|---|
| Mar 2016 | EB-3 | 19 months | 2015-05-01 | no change | back 12 months (2014-05-01) |
| May 2017 | EB-3 | 16 months | 2015-09-01 | no change | forward 4 more |
| Feb 2018 | EB-2 | 12 months | 2014-11-15 | forward 4.5 more | forward 11.5 more |
| Oct 2019 | EB-3 | 9 months | 2017-03-01 | no change | forward 15 more |
| Oct 2020 | EB-3 | 13 months | 2018-06-01 | forward 2 more | forward 7.5 more (it reached 2019-07-01 in between, then slipped back) |
| Oct 2023 | EB-3 | 10 months | 2020-09-01 | forward 10 more | forward 2.5 more (it reached 2021-07-01 in between, then slipped back) |
| Jan 2024 | EB-3 | 10 months | 2021-07-01 | no change | back 7.5 months (2020-11-15) |
| Oct 2025 | EB-3 | 12 months | 2022-01-01 | no change | forward 27 more (this is October 2026) |
| Oct 2025 | EB-2 | 11 months | 2021-12-01 | forward 1 more | forward 13 more (this is October 2026) |
"Forward" and "back" are measured from the date it jumped to. October 2023 and January 2024 were back-to-back jumps, and they were later reversed together.
Across these 9 jumps:
- After 6 months: 5 had not moved at all, 3 moved only 1 to 4.5 months further, and 1 (October 2023) jumped again. In the first half year after a Chart B jump, it mostly stayed where it was.
- After 12 months: 7 were further ahead than the jump date and 2 were behind it (March 2016 and January 2024). In 4 cases the date after 12 months was lower than the highest point reached during those 12 months, meaning it slipped back at some point.
- The last two rows (October 2025) have their "after 12 months" in this month's bulletin, so they are not yet finished precedents.
This table only shows how it went before. It is 9 cases, each in a different situation (visa numbers, policy, number of applicants), and it is not a forecast.
Why did mainland China move but India did not?
Here is what we can say for sure: we are reading only the dates in the bulletins, not guessing at causes.
- October bulletin, Chart B, mainland China: EB-3 went from 2022-01-08 in September to 2024-04-01 (about 27 months), and EB-2 from 2022-01-01 to 2023-01-01 (12 months).
- October bulletin, Chart B, India: EB-2 and EB-3 are both 2015-01-15, the same as September and the same as the April bulletin.
- Chart A (the one that allows approval): mainland China EB-2 is 2021-10-01 (2021-09-01 in September) and EB-3 is 2022-01-08 (2022-01-01 in September), so only a few days to a month. India EB-3 is 2014-01-01, unchanged from September; India EB-2 was “U” (unavailable) in September and is 2013-11-01 in October.
- How far apart they are: on October Chart B, mainland China EB-3 is in 2024 and India is in 2015, nine years apart.
These numbers show who moved, not why. Our database stores the dates from each bulletin, not the explanatory notes the State Department writes; check the official bulletin for any explanation. We do not treat explanations such as “more people are waiting in the India line” as an answer, because this data cannot show that.
05 What to watch from here
We don't predict, but a few things you can check yourself:
- Which chart USCIS says to use for November. USCIS usually posts it shortly after the State Department bulletin; check the official page. In 2020 Chart B was used for three months in a row (October, November, December) and USCIS went back to Chart A in January 2021.
- Whether Chart A moves. This time Chart B jumped and Chart A did not. In the year after 2020, Chart A moved steadily forward. If Chart A starts moving in the coming months, it is about more than filing.
- Whether the State Department's bulletin notes say anything about this year's visa numbers. That is the piece we are missing most.
Related pages
- This month's bulletin: October 2026 Visa Bulletin analysis
- Community prediction data: 3,222 People Predicted the Visa Bulletin: Betting on Movement Lost Every Month for Seven Months and community predictions
- Enter your priority date and see the EB-2 and EB-3 history: EB-2 vs EB-3 tool
- Every month's dates: bulletin history
- Whether to downgrade: EB-2 to EB-3 downgrade after the October Chart B jump
This is general information, not legal advice.
Sources
- Bulletin data: State Department Visa Bulletins, October 2015 to October 2026 (China mainland EB-1, EB-2, EB-3, Charts A and B), from our bulletin history. The "moved" and "forward/back" figures are our own calculations from bulletin dates, not official statistics.
- State Department: September 2021 Visa Bulletin, with the FY 2021 limits (family 226,000, employment 262,288)
- USCIS: Fiscal Year 2022 Employment-Based Adjustment of Status FAQs (updated August 26, 2022), on FY 2021 employment-based visa use and the FY 2022 limit of 281,507
- USCIS: Adjustment of Status Filing Charts from the Visa Bulletin: Dates for Filing for employment-based in October 2026; its October to December 2020 pages show the Dates for Filing chart and its January 2021 page shows the Final Action Dates chart
One email each month when the bulletin lands. Unsubscribe anytime.