

You may have seen an article going around: fewer Chinese students are coming to the US, so the EB-2 and EB-3 waits will get shorter. It comes from a blog post by a writer who goes by fallen (original here, published under a CC0 public-domain license).
Short answer: the direction makes sense, but the timing is too optimistic. Chinese student numbers really are falling, and over the long run fewer new people entering the queue could ease the wait. But we went through the USCIS data, and the number of China-born people filing I-140s (the first step of an employment-based green card) has not gone down in recent years. It has gone up. The number of people already waiting has not shrunk either. So don't expect EB-2 (second preference, advanced degrees) or EB-3 (third preference, skilled workers) to speed up because of this in the next 2 to 3 years.
One note first: this article covers direction and time range only. It does not predict where the dates will be in any particular month.
01 How much have student numbers dropped?
The Institute of International Education (IIE) publishes Open Doors every year, and it includes the total number of Chinese students in the US. These are IIE's figures:
| Academic year | Chinese students in the US |
|---|---|
| 2018/19 | 369,548 |
| 2019/20 | 372,532 |
| 2020/21 | 317,299 |
| 2021/22 | 290,086 |
| 2022/23 | 289,526 |
| 2023/24 | 277,398 |
| 2024/25 | 265,919 |
From the 2019/20 peak to 2024/25, that is 106,613 fewer students, a drop of about 29%. The original article is right about this: the trend is real. Open Doors' fall 2025 snapshot also shows that new international students enrolling in US colleges (all countries combined; China is not broken out) were down 17% from the year before. We come back to that below.
02 How long from starting school to getting a priority date?
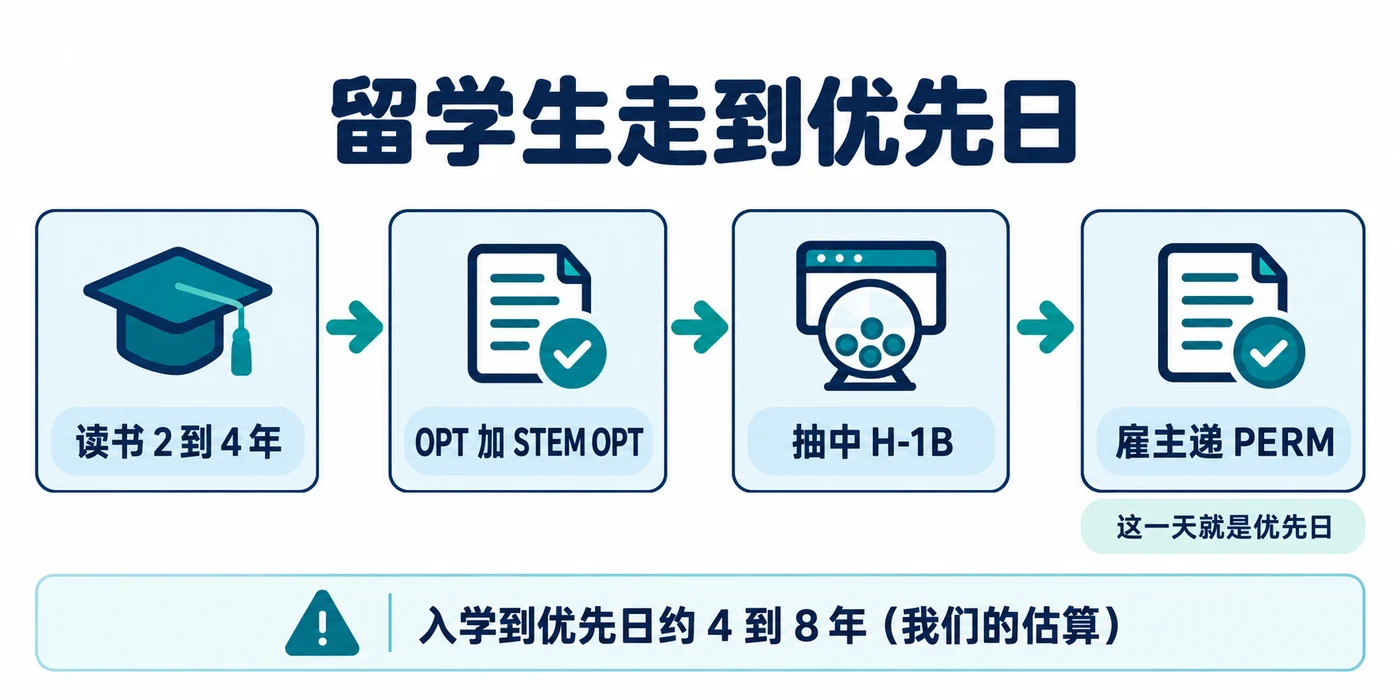
The original article does not go into this step. Fewer students does not necessarily shrink the queue right away, because a long road sits between school and the green card line.
The queue runs on your priority date (PD, your place in line). A typical path from student to priority date looks like this:
- Study for 2 to 4 years.
- Work on OPT (post-graduation work permission), plus up to 2 more years of STEM OPT in science and engineering fields.
- Win the H-1B (work visa) lottery.
- Your employer starts PERM (the labor certification). For EB-2 and EB-3, the priority date is the day the PERM is filed.
So from enrollment to priority date usually takes 4 to 8 years, depending on how long you study and which year you win the H-1B lottery. That range is our own estimate based on this path, not a USCIS statistic.
Here is an example. Someone who started a master's in fall 2020 graduated in 2022, and OPT plus STEM OPT runs to 2025 at the longest, so their priority date lands somewhere in 2024 to 2027. In other words, the effect of fewer students can show up in priority dates in 2024 at the earliest.
03 The people already in line are not going anywhere
The current dates are still far from the point where "fewer new entrants" would matter. Below are the China mainland EB-2 and EB-3 Final Action Dates (Chart A) from each October visa bulletin:
| October bulletin | EB-2 Chart A | Wait | EB-3 Chart A | Wait |
|---|---|---|---|---|
| 2019 | 2015-01-01 | about 4.7 years | 2015-11-01 | about 3.9 years |
| 2020 | 2016-03-01 | about 4.6 years | 2017-07-01 | about 3.3 years |
| 2021 | 2018-07-01 | about 3.3 years | 2019-01-08 | about 2.7 years |
| 2022 | 2019-06-08 | about 3.3 years | 2018-06-15 | about 4.3 years |
| 2023 | 2019-10-01 | about 4.0 years | 2020-01-01 | about 3.7 years |
| 2024 | 2020-03-22 | about 4.5 years | 2020-04-01 | about 4.5 years |
| 2025 | 2021-04-01 | about 4.5 years | 2021-03-01 | about 4.6 years |
| 2026 | 2021-10-01 | about 5.0 years | 2022-01-08 | about 4.7 years |
"Wait" is October 1 of that year minus the Chart A date, in actual days divided by 365.25, rounded to one decimal. We calculated it. Over the past seven years it has swung between 2.7 and 5 years, and this year it sits at the high end.
Everyone with a priority date after these Chart A dates, that is, people who got their priority dates in 2022 or later, is already in the line. They are mostly from earlier, larger classes of students, plus people who filed an NIW on their own. Fewer students in recent years only shrinks the group who file PERM later. The people already in line do not disappear because of it.
04 USCIS data: the line has not shrunk, and I-140 filings went up
We used two sets of USCIS data.
First: people with an approved petition who are still waiting for a visa number. This is the table behind our data center's queue page, split by country of birth. These are principal applicants born in mainland China whose I-140 is approved but whose priority date has not come up yet (spouses and children not counted):
| As of | EB-2 | EB-3 |
|---|---|---|
| September 2024 | 33,318 | 11,226 |
| March 2025 | 36,172 | 12,418 |
| June 2025 | 34,608 | 11,652 |
| March 2026 | 33,501 | 11,656 |
| June 2026 | 34,936 | 11,070 |
Over almost two years, EB-2 has moved up and down between 33,000 and 36,000, and EB-3 between 11,000 and 12,000. There is no sign of the line getting shorter.
Two things to keep in mind. Each principal applicant has on average 1.2 family members behind them who also use up visa numbers, so the numbers needed are about 2.2 times the count in the table. And one person may have filed more than one petition, which gets counted twice. Both points are explained in more detail on the data center page.
Second: how many I-140s were filed each year. The table below shows USCIS's count of China I-140 receipts by the year they were filed (the fiscal year runs from October of the prior year through September; fiscal 2026 covers only the first nine months, through the end of June):
| Fiscal year | EB-2 receipts | Of which approved national interest waivers (NIW) | EB-3 receipts |
|---|---|---|---|
| 2019 | 11,009 | 1,865 | 4,139 |
| 2020 | 11,051 | 2,516 | 4,862 |
| 2021 | 10,020 | 1,780 | 10,503 |
| 2022 | 10,355 | 2,589 | 4,183 |
| 2023 | 13,113 | 4,826 | 3,535 |
| 2024 | 17,444 | 6,588 | 7,841 |
| 2025 | 18,408 | 3,639 | 3,433 |
| 2026 (first nine months) | 11,499 | 1,027 | 3,339 |
EB-2 receipts stayed a little over 10,000 from 2019 to 2022, then rose to 13,113 in 2023, 17,444 in 2024 and 18,408 in 2025, the two highest years in this table. By the timeline in the last section, the class that started school in 2020 should begin showing up in priority dates around 2024. But receipts in 2024 and 2025 did not fall. They were the highest.
The NIW column (a national interest waiver lets you file an I-140 on your own without an employer, and it uses the same EB-2 line) needs two more comments:
- The 2025 and 2026 figures look low because many cases have not been decided yet (5,972 EB-2 petitions filed in fiscal 2025 are still pending), so those two rows cannot be compared directly with earlier years.
- Denials went up too. Denied China EB-2 petitions were 453 for fiscal 2023, 1,915 for 2024 and 2,679 for 2025.
- The USCIS table does not say whether the person was in the US or abroad when the petition was filed, so we cannot use it to directly test the claim that more people abroad are filing NIWs.
Also, EB-3 receipts jumped to 10,503 in fiscal 2021. We did not find out why, so we do not explain it here.
05 Who is affected and who is not
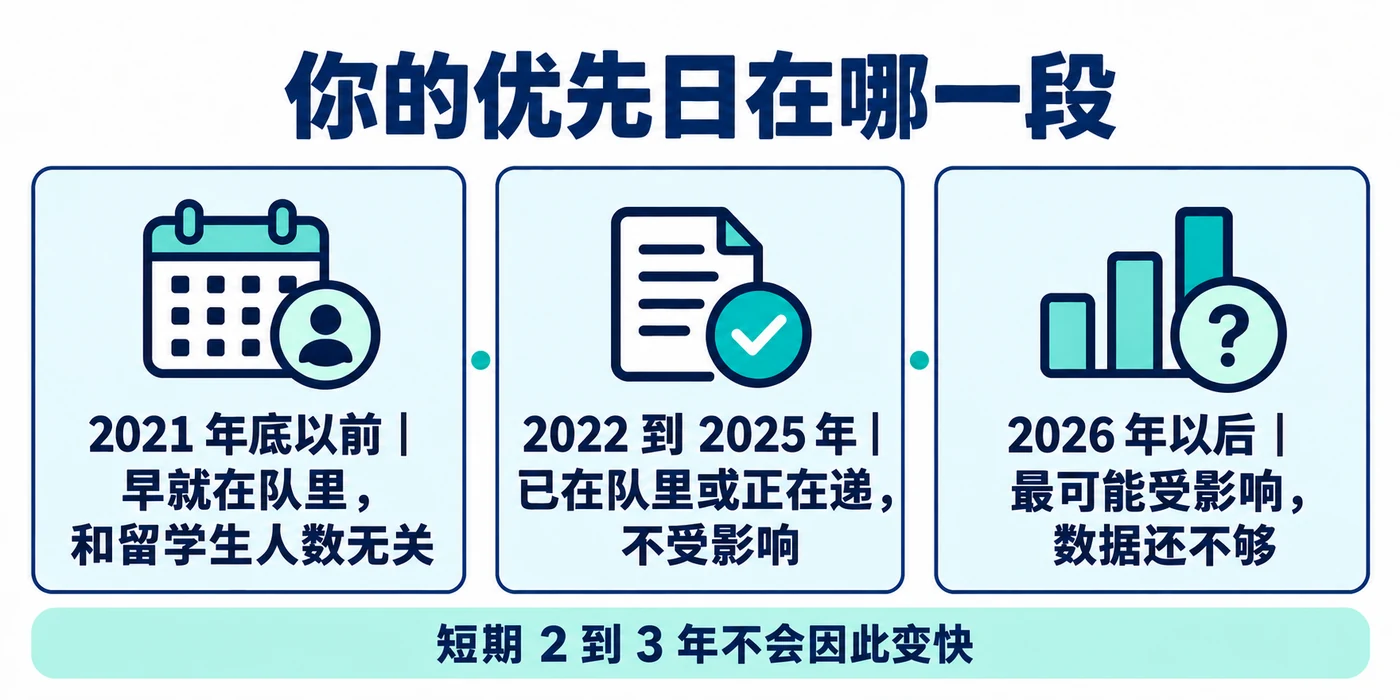
Here are three groups. Find yours:
- Priority date before the end of 2021 (people who are current or about to become current): these people have been in the line for a long time, so student numbers do not matter to them.
- Priority date in 2022 to 2025 (I-140 filed, or about to be): there are a lot of you. China EB-2 receipts for fiscal 2022 through 2025 add up to 59,320 petitions and EB-3 to 18,992 (these are petition counts, not people, and family members are extra). Fewer students does not affect the line you are in.
- Priority date in 2026 or later: this is where fewer students is most likely to matter. Whether it eases the wait, and by how much, the data cannot say yet.
So our conclusion: in the short term (the next 2 to 3 years), the wait will not get shorter just because there are fewer students. In the long term, if the number of new entrants keeps falling, it may ease. That "may" is a guess, not a promise.
06 Three things the original article does not cover
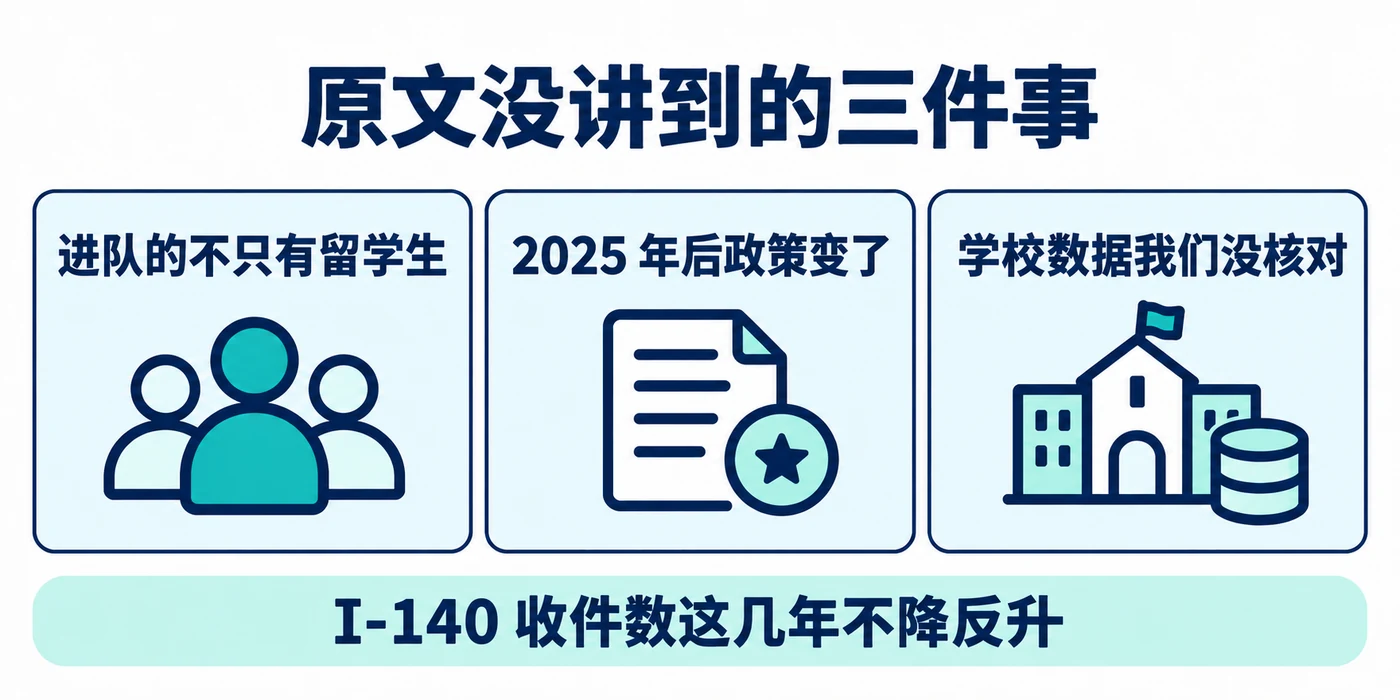
The original was written in November 2024 and covers students and graduate destinations, with data up to that point. Three things are outside it:
- Students are not the only people entering the line. People already working in the US, people filing NIWs on their own, and China-born people who immigrated from other countries all join the same line. The I-140 data above says more people have been joining in recent years, not fewer.
- Policy changed after 2025. First, fewer new international students are arriving: Open Doors shows that new international enrollment in fall 2025 was down 17% from the year before (all countries; the report does not break out China). Second, the H-1B entry restriction: in September 2025 the White House issued a proclamation restricting entry on H-1B unless $100,000 is paid, and in September 2026 it was extended for a year. In June 2026, though, a federal court set aside the agency guidance for collecting that payment, and USCIS is not collecting it for now, so what happens next is unclear (see this report). For people already in the US who are going through the green card process, the text of the proclamation has no direct connection to your extension or a change of employer. If the first trend continues, fewer people will enter the line later, which points the same way as the original article. The second is still too uncertain to call.
- The Tsinghua and Fudan graduate destination figures the original cites (Tsinghua graduates going abroad: 28.2% in 2017, 24.6% in 2019, 14.0% in 2022; Fudan graduates going to the US: 53.9% in 2019, 32.61% in 2021) come from university reports quoted by the original author. We did not check them one by one and only relay them here.
07 What to do now
- Don't put off what you have in hand because of articles like this. How fast the dates move is out of your hands. What you can do is file your I-140 and I-485 (the application to get a green card from inside the US) when you're eligible, and that does not change.
- To see roughly where you stand, try our wait-time estimator or read "How long until my priority date".
- If you could go either EB-2 or EB-3, start with our EB-2 vs EB-3 tool.
- For how the latest bulletin moved, see our October 2026 visa bulletin analysis.
Sources
- Open Doors 2025 (IIE and the State Department, released November 17, 2025): China data sheet, press release (including the 17% drop in new international enrollment in fall 2025)
- USCIS: I-140 receipts and current status by country and category, fiscal 2014 through fiscal 2026 Q3
- USCIS: approved petitions awaiting a visa number (June 2026; this USCIS table groups I-140 with two other special categories), compiled on our data center queue page; the family-member multiplier comes from the DHS Yearbook of Immigration Statistics, fiscal 2024
- State Department visa bulletins, October 2019 through October 2026, compiled in our bulletin history
- The original: fallen, "Green Card Wait Times", https://www.fallen.moe/posts/gc-1, CC0 1.0
- The "Wait" column, the "4 to 8 years from enrollment to priority date" range and the comparison with fiscal 2024 are our own estimates, not official figures
One email each month when the bulletin lands. Unsubscribe anytime.